
Exploring the XYZ Mapping Process: Key Concepts and Techniques

Accurate pipeline records are essential for inspection, maintenance, excavation, and long-term asset planning. However, original drawings may be incomplete, outdated, or unable to show the pipeline’s exact position beneath roads, waterways, industrial sites, and developed areas.
XYZ pipeline mapping creates a three-dimensional record of a pipeline’s actual route. It helps operators understand where the line is located, how it changes in elevation, where bends occur, and how specific pipeline features relate to the surrounding environment.
What Is XYZ Pipeline Mapping?
XYZ pipeline mapping is an in-line mapping method used to record the horizontal and vertical position of a pipeline. A specialized mapping tool travels through the line and collects movement, orientation, and distance data.
The information is processed to reconstruct the pipeline centerline and create a detailed route profile. This allows pipeline owners to compare actual field conditions with existing drawings, GIS records, and installation plans.
Understanding the XYZ Mapping Process
The XYZ mapping process involves the collection, analysis, and visualization of spatial data using specialized tools and techniques. It primarily focuses on three dimensions: X, Y, and Z. Here's a breakdown of each dimension:
X-axis: Represents the horizontal or east-west direction. It provides information about the location of a particular point on the map in relation to the east-west axis. By analyzing the X-axis data, professionals can understand the spatial relationships between different points and identify any east-west patterns or variations.
Y-axis: Represents the vertical or north-south direction. It provides information about the location of a particular point on the map in relation to the north-south axis. Analyzing the Y-axis data helps professionals understand the spatial relationships between different points and identify any north-south patterns or variations.
Z-axis: Represents the elevation or depth. It provides information about the vertical position of a particular point on the map. By analyzing the Z-axis data, professionals can understand the elevation changes in an area, such as hills, mountains, or valleys. This information is crucial for various applications, including urban planning, construction, and environmental management.
By incorporating these three dimensions, XYZ mapping provides a comprehensive view of an area, enabling professionals to analyze spatial relationships, patterns, and variations effectively.
What Do X, Y, And Z Represent?
The three coordinates describe the pipeline’s location in space:
X represents the east-west position
Y represents the north-south position
Z represents elevation or depth
Together, these coordinates produce a three-dimensional model of the pipeline route.
Pitch, roll, heading, and azimuth are also recorded during many mapping runs. These measurements describe the tool’s orientation and help calculate the final pipeline trajectory, but they are not the same as the finished XYZ coordinates.
Pipeline Experts: Inspection, Cleaning, Coating & More
Certified solutions for inspection, pre-commissioning, cleaning, internal coating, ice pigging™, mapping, and turnkey pipeline projects—maximizing safety and reliability at every stage.
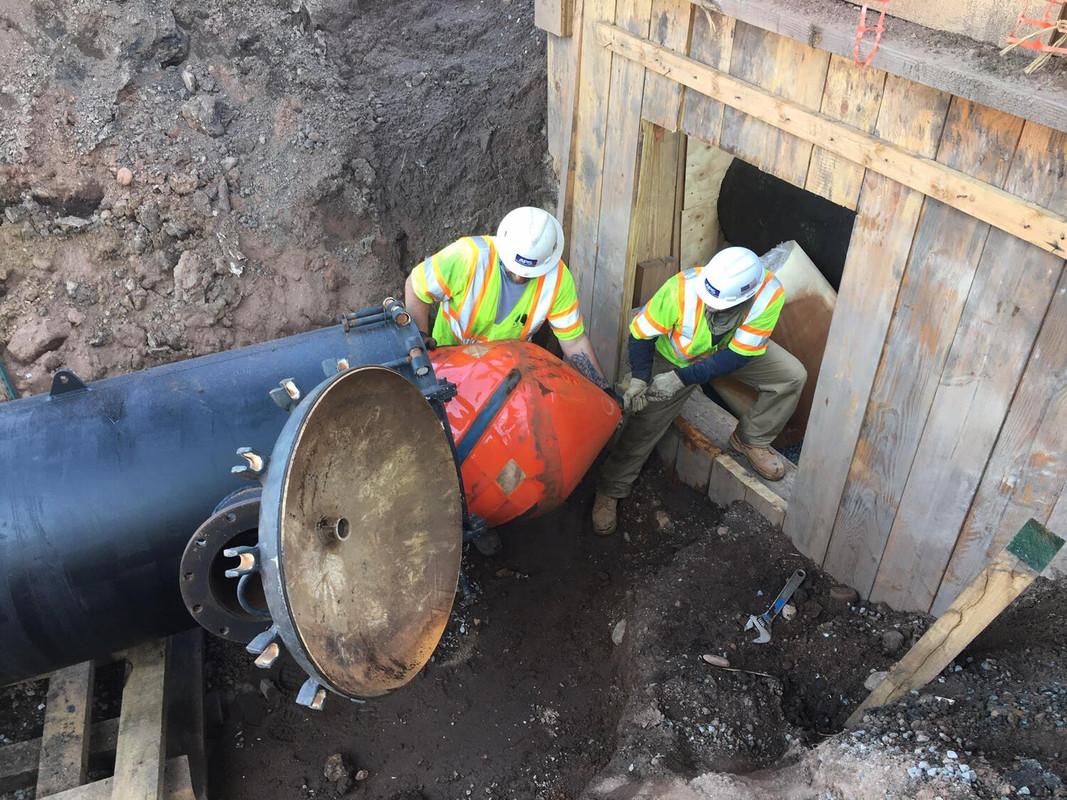
Why Accurate Pipeline Mapping Matters
Many pipelines were installed years before modern digital mapping systems became standard. Even when drawings exist, they may contain approximate alignments, missing depth information, or changes that were never documented.
Accurate mapping gives pipeline owners better information for maintenance, inspection, construction, and emergency planning.
Safer Excavation And Construction
Knowing the pipeline’s precise route and depth can reduce unnecessary excavation and lower the risk of accidental strikes. This is especially important where pipelines cross beneath roads, railways, buildings, waterways, or congested utility corridors.
Reliable underground utility mapping also helps project teams coordinate work around nearby infrastructure.
Better Maintenance And Repair Planning
XYZ data can help crews locate bends, valves, fittings, welds, connections, and reported inspection features. Instead of excavating a broad area, teams can focus on the section where work is required.
Accurate location data can also support tie-ins, pipeline modifications, and rehabilitation projects.
Improved As-Built Records
Processed mapping data can be added to engineering drawings, asset databases, and geographic information systems. This gives utilities and pipeline operators a more accurate record for future planning.
Key Components of the XYZ Mapping Process
To carry out the XYZ mapping process, several key components come into play. Let's take a closer look at each of them:
Data Collection
Data collection is the initial and crucial step in the XYZ mapping process. It involves gathering relevant spatial data from various sources, such as surveys, remote sensing, and GPS technologies. This data includes coordinates, elevation, attributes, and other relevant information. The accuracy and quality of the collected data are essential for the success of the XYZ mapping process.
Data Processing and Analysis
Once the data is collected, it undergoes processing and analysis to extract meaningful insights. This involves cleaning the data, organizing it, and performing statistical analyses. Advanced analytical techniques, such as geospatial algorithms and machine learning, may also be employed to identify spatial patterns and relationships. By analyzing the data, professionals can uncover hidden patterns, trends, and anomalies that can provide valuable insights for decision-making.
Visualization and Mapping
Visualization is a crucial component of the XYZ mapping process as it aids in interpreting and communicating the analyzed data effectively. Specialized software tools like Geographic Information Systems (GIS) are used to create maps, models, and interactive visualizations. These visual representations provide a clear understanding of the spatial data, making it easier for decision-makers to identify trends and patterns. Additionally, the use of color coding, shading, and symbols can further enhance the visualization and interpretation of the data.
Interpretation and Decision Making
The interpreted spatial data obtained through the XYZ mapping process enables professionals to make informed decisions. By analyzing and archiving the data, asset owners can reduce costs and risk while increasing efficiency and situational awareness. For example, urban planners can use the interpreted spatial data to identify suitable areas for development, asset owners can ensure that cross boring does not take place with new pipeline installations.

Benefits of the XYZ Mapping Process
The XYZ mapping process offers numerous benefits across various industries. Some of the key advantages include:
Enhanced Data Analysis: By incorporating three dimensions, XYZ mapping provides a more comprehensive analysis of spatial data, enabling professionals to gain deeper insights into patterns and relationships. This enhanced analysis helps in understanding the spatial distribution of various phenomena, such as population density, land use patterns, and natural resource availability.
Improved Decision Making: The interpreted spatial data helps stakeholders make informed decisions, leading to optimized resource allocation, reduced costs, and improved productivity. For example, in urban planning, decision-makers can use the XYZ mapping process to identify areas for infrastructure development, optimize transportation networks, and plan for sustainable growth.
Effective Communication: Visual representations created through the XYZ mapping process enable clear and concise communication of complex spatial data, facilitating better collaboration among team members and stakeholders. By using maps, models, and interactive visualizations, professionals can effectively convey spatial information, making it easier for non-experts to understand and participate in decision-making processes.
Increased Efficiency: By identifying spatial patterns and relationships, the XYZ mapping process helps in streamlining processes, enhancing workflows, and improving overall efficiency. For example, in logistics and transportation, the process aids in optimizing routes, analyzing traffic patterns, and managing supply chains, leading to cost savings and improved delivery times.
Better Planning and Resource Management: The insights obtained through XYZ mapping assist in better planning, such as urban development, natural resource management, and infrastructure projects. It enables stakeholders to allocate resources effectively and ensure sustainable growth. For instance, in agriculture, the XYZ mapping process can help optimize land use, monitor crop growth, and manage water resources, resulting in increased yields and reduced environmental impact.
Applications of the XYZ Mapping Process

The XYZ mapping process finds its application in various industries and fields. Some notable applications include:
The XYZ mapping process is used across a wide range of industries due to its ability to collect highly accurate spatial data in three dimensions (X, Y, and Z coordinates). Here are some of the most important real-world applications:
Pipeline Mapping
XYZ mapping is commonly used in the oil, gas, and utility industries to map the exact position of underground pipelines. It helps determine the horizontal and vertical location of pipes and detects features like valves, weld joints, fittings, and any abnormalities. The data also helps assess bending strain and identify areas where displacement or stress may lead to damage. This ensures better pipeline maintenance, safety, and regulatory compliance.
Infrastructure Mapping
For construction and civil engineering projects, XYZ mapping creates accurate 3D models of structures such as roads, bridges, buildings, and tunnels. These models are useful for planning, design, and ongoing maintenance. The precise spatial information helps engineers make informed decisions, avoid costly errors, and ensure long-term structural stability.
Geographic Information Systems (GIS)
In GIS applications, XYZ data supports the creation of detailed spatial databases and maps. It provides the high-resolution location data needed for land use planning, zoning, environmental studies, and resource management. The depth (Z-coordinate) adds a layer of insight that enhances terrain analysis, flood modeling, and urban development planning.
Robotics and Automation
XYZ mapping plays a key role in robotics by giving machines the spatial awareness needed to navigate their surroundings. In automated manufacturing, drones, autonomous vehicles, and warehouse robots rely on XYZ data to move accurately, avoid obstacles, and perform complex tasks. It’s also used in simulation environments to train robots using real-world spatial data.
Urban Planning and Development
By analyzing spatial data, XYZ mapping aids urban planners in designing cities, infrastructure, and transportation networks. It helps in identifying suitable areas for development, optimizing land use, and ensuring efficient resource allocation. Urban planners can use the XYZ mapping process to analyze population density, land suitability, transportation infrastructure, and other factors to make informed decisions about urban development and growth.
Environmental Management
XYZ mapping plays a crucial role in environmental management by monitoring and analyzing ecological systems. It helps in identifying areas vulnerable to natural disasters, managing wildlife habitats, and assessing the impact of human activities on the environment. Environmental managers can use the XYZ mapping process to analyze data related to biodiversity, habitat suitability, and environmental stressors to develop effective conservation and management strategies.
Construction and Engineering
In the construction and engineering sectors, XYZ mapping assists in site analysis, surveying, and project management. It supports the identification of potential risks, efficient allocation of resources, and accurate project planning. Construction and engineering professionals can use the XYZ mapping process to analyze topography, assess site suitability, and plan construction projects to ensure safety, efficiency, and cost-effectiveness.
Excavation Planning
Accurate XYZ data allows teams to plan excavation work with confidence. By knowing the exact depth and position of underground assets, crews can dig safely and efficiently—avoiding costly utility strikes or unnecessary over-excavation. This is especially important in congested urban environments or complex project sites.
Pipeline Experts: Inspection, Cleaning, Coating & More
Certified solutions for inspection, pre-commissioning, cleaning, internal coating, ice pigging™, mapping, and turnkey pipeline projects—maximizing safety and reliability at every stage.
Agriculture and Forestry
XYZ mapping is used in agriculture and forestry to optimize land use, monitor crop growth, and assess forest resources. It helps in improving crop yields, preventing soil erosion, and managing forest ecosystems effectively. Farmers and foresters can use the XYZ mapping process to analyze soil fertility, moisture availability, and vegetation health to make informed decisions about crop selection, irrigation, and forest management practices.
Transportation and Logistics
The XYZ mapping process aids in transportation and logistics by optimizing routes, analyzing traffic patterns, and managing supply chains. It enables efficient delivery of goods and services, reducing costs and enhancing overall logistics operations. Transportation and logistics professionals can use the XYZ mapping process to analyze transportation networks, traffic congestion, and demand patterns to develop efficient routes, improve delivery times, and reduce carbon emissions.
The XYZ mapping process is a powerful tool that enables professionals to visualize, analyze, and interpret spatial data effectively. By incorporating three dimensions, it provides a comprehensive understanding of patterns and relationships, leading to informed decision-making, improved efficiency, and better resource management. With its applications spanning across various industries, XYZ mapping continues to play a vital role in shaping our world.
What Technology Is Used For XYZ Mapping?
XYZ mapping relies on several technologies working together. The exact tool configuration depends on the pipeline and required results.
Inertial Measurement Units
An inertial measurement unit, or IMU, records movement and orientation from inside the pipeline.
Because ordinary GPS signals cannot travel reliably through soil or pipe walls, an IMU allows the tool to track its motion while underground.
Gyroscopes And Accelerometers
Gyroscopes measure rotational movement and changes in orientation. Accelerometers record linear acceleration and help identify changes in the tool’s motion.
Together, these sensors allow the system to calculate how the pipeline changes direction and elevation.
Odometers
Odometer wheels measure the distance traveled through the line. This information helps place bends, fittings, and other features at the correct position along the pipeline route.
Wheel slip, debris, and changing internal conditions may affect distance measurements, which is why validation remains important.
GPS And Survey Control
GPS generally supports the surface reference points rather than directly tracking the underground tool.
Surveyed locations help connect the in-line measurements to a recognized coordinate system and improve the accuracy of the final map.
What Information Does XYZ Mapping Provide?
Depending on the project scope, XYZ mapping may provide:
Pipeline centerline coordinates
Elevation and depth profiles
Bend locations and geometry
Valves, fittings, welds, and connections
Locations of reported inspection features
Pipeline curvature and alignment
Data for engineering drawings and GIS systems
Evidence of movement between repeated surveys
XYZ mapping primarily establishes pipeline location and geometry. It should not be treated as a complete corrosion or wall thickness inspection unless it is combined with suitable inspection technology.
How XYZ Mapping Supports Pipeline Inspection
Mapping data becomes especially valuable when combined with inspection findings. It allows pipeline owners to connect a reported condition with a specific location in the field.
Locating Inspection Features
Inspection tools may identify dents, deformations, corrosion, unusual bends, or other conditions. XYZ coordinates help crews determine where those features are located before excavation or verification work begins.
Combining Mapping With Smart Pigging
Mapping systems may operate independently or alongside geometry, caliper, magnetic, or other in-line inspection tools.
When combined with smart pigging, the mapping data can help relate inspection results to pipeline position, elevation, and surrounding conditions.
Supporting Pressure Pipe Inspection
Accurate route information can improve planning for pipeline inspection, particularly where records are incomplete or access is difficult.
It may also help inspection teams understand pipeline geometry, identify suitable entry points, and locate conditions that require follow-up.
When Should Pipeline Owners Use XYZ Mapping?
XYZ mapping may be appropriate when:
Pipeline drawings are missing or unreliable
Field conditions do not match existing records
An excavation or tie-in is planned
The pipeline passes beneath roads, rivers, or structures
Movement or ground instability is suspected
Inspection features need precise coordinates
Updated GIS data is required
A new installation needs route verification
The most suitable mapping method depends on pipeline access, geometry, operating conditions, and project goals.
Pipeline Mapping With American Pipeline Solutions
American Pipeline Solutions provides pipeline mapping support for complex underground systems, including pipelines and conduits with limited access, multiple bends, changing elevations, and incomplete records.
The team evaluates each line before selecting the mapping method and deployment approach. The resulting data can support excavation, inspection, engineering, GIS updates, maintenance planning, and condition analysis.
APS also integrates mapping with broader pipeline pigging and inspection services, helping clients understand both where a pipeline is located and how its condition may affect future decisions.
FAQs:
What is the XYZ mapping process?
The XYZ mapping process involves collecting and analyzing three-dimensional spatial data—X (east-west), Y (north-south), and Z (elevation or depth). This method provides an accurate 3D representation of underground or surface assets, helping engineers, surveyors, and pipeline specialists visualize conditions and make data-driven decisions.
How is XYZ mapping used in pipeline projects?
In the oil, gas, and utility industries, XYZ mapping precisely records the horizontal and vertical position of pipelines. It helps identify weld joints, fittings, valves, and areas of potential bending or stress. APS uses XYZ mapping to support safer excavations, reduce cross-bore risks, and ensure regulatory compliance during maintenance or new construction.
Why is the Z-axis so important in XYZ mapping?
The Z-axis measures elevation or depth—crucial for understanding pipeline grades, slopes, and cover depth. It allows engineers to detect high or low points, assess risk of strain, and confirm compliance with depth-of-cover requirements. Without accurate Z-axis data, pipeline assessments and excavation plans can become unreliable or unsafe.
What technologies are used to collect XYZ mapping data?
XYZ mapping typically uses GPS, LiDAR, total stations, and remote sensing tools to capture coordinates and elevations. APS integrates these technologies with GIS software to create accurate 3D models, ensuring precision in both design and field verification. The choice of tools depends on site complexity and required accuracy.
How does XYZ mapping improve safety during excavation?
By showing the precise location and depth of buried pipelines and utilities, XYZ mapping allows excavation teams to dig confidently and avoid damaging live assets. This process minimizes unplanned outages, safety incidents, and repair costs, especially in urban or congested project areas.
Can XYZ mapping help with regulatory compliance?
Yes. Regulatory standards often require accurate spatial documentation of underground infrastructure. XYZ mapping provides auditable data that supports as-built verification, inspection readiness, and ongoing asset management—key for meeting federal and state compliance requirements in pipeline construction and maintenance.
How does APS use XYZ mapping data for decision-making?
APS combines XYZ data with inspection and integrity data to evaluate pipeline conditions, detect anomalies, and plan maintenance. By integrating spatial analysis into project design, we help clients reduce risk, optimize workflows, and make informed engineering and operational decisions.
What industries benefit most from XYZ mapping?
While essential for pipelines and utilities, XYZ mapping also benefits construction, environmental management, transportation, and agriculture. Any project requiring accurate spatial positioning—whether mapping underground assets, analyzing terrain, or modeling infrastructure—can leverage XYZ mapping for safer, more efficient planning.
How does XYZ mapping differ from GIS?
XYZ mapping is focused on precise three-dimensional measurements and geometry, while GIS (Geographic Information Systems) organizes, stores, and visualizes that data in map form. In practice, XYZ mapping provides the raw 3D coordinates that feed into GIS for modeling, analysis, and decision support.


